Grouped bar graphs using facet_grid in ggplot2
Abstract
A brief talk showcasing how to use the facet_grid function in ggplot2 to graph Year 12 completion rates by grouped demographic characteristics.
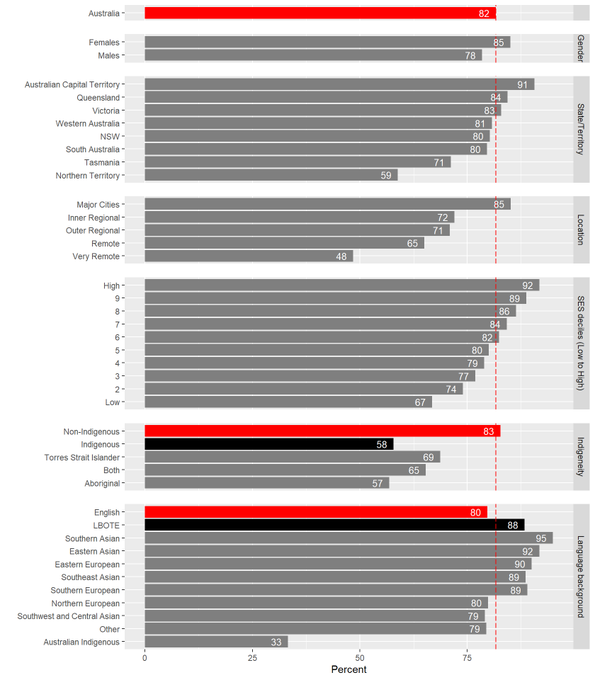
The proportion of Australian students completing Year 12 varies considerably with a range of demographic characteristics (e.g., gender, State/Territory, geographic location, socio-economic status, language background, and Indigenous status). In this brief talk I explained how I used the facet_grid function in ggplot2 to graph Year 12 completion rates for 19 year olds based on data from the Australian Census of Population and Housing 2016, as reported in Lamb et al. (2020).
Lynley Aldridge
My research interests include social and educational inequality, transitions from education to employment, education, cross-cultural comparative research, migration/mobility, mental health/wellbeing, and Rstats.