Posts
More experimenting with SQL in R Markdown: Pivoting data, outputting results to R, and creating a summary table using gt
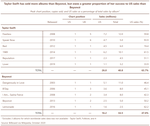
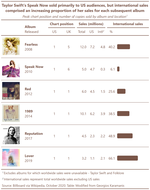
Following on from my previous post, I use SELECT and JOIN statements to pivot the Taylor Swift and Beyoncé Tidy Tuesday data using RSQLite (after normalizing the underlying database), output the results to R, and create a relatively simple summary table using gt.
Experimenting with SQL in RMarkdown: SELECT, UPDATE and JOIN queries using RSQLite
In this post I talk through, step-by-step, a process I’ve been using to document the SQL learning I’ve been doing using R Markdown. I draw on a tutorial by Andrew Couch to create a database I can manipulate using RSQLite, using a Tidy Tuesday dataset featuring Taylor Swift and Beyoncé album data.
Why start a blog?
Hello world! In this, my first post, let’s start with a variant on two of those old existential chestnuts, ‘Who am I?’ and ‘Why am I here?’ Or more precisely, what brings me to rstats and why am I wrestling with GitHub, blogdown and Hugo to create this blog at this particular time in my life?


